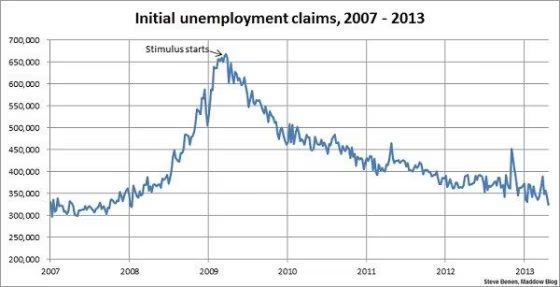
For the third consecutive week, the figures on initial unemployment claims from the Department of Labor offered unexpectedly good news.
The number of people who applied last week for new unemployment benefits touched the lowest level since January 2008, falling by 18,000 to 324,000, the U.S. Labor Department said Thursday. Economists polled by MarketWatch had expected claims to rise to a seasonally adjusted 345,000 in the week ended April 27 from a revised 342,000 in the prior week. The average of new claims over the past month, which smoothes out weekly volatility, dropped by 16,000 to 342,250. That's the lowest level in six weeks.
The last time we saw jobless claims this low was Jan. 19, 2008.

 FOR SUBSCRIBERSCBP leaders cut out of Trump ad buy decision









FOR SUBSCRIBERSA harrowing ordeal aboard an Israel-bound plane





To reiterate the point I make every Thursday morning, it's worth remembering that week-to-week results can vary widely, and it's best not to read too much significance into any one report.
FOR SUBSCRIBERSCBP leaders cut out of Trump ad buy decision
FOR SUBSCRIBERSA harrowing ordeal aboard an Israel-bound plane
In terms of metrics, when jobless claims fall below the 400,000 threshold, it's considered evidence of an improving jobs landscape, and when the number drops below 370,000, it suggests jobs are being created rather quickly. We've been below the 370,000 threshold 17 of the last 20 weeks. Today's total is the best report since early March.
Above you'll find the chart showing weekly, initial unemployment claims going back to the beginning of 2007. (Remember, unlike the monthly jobs chart, a lower number is good news.) For context, I've added an arrow to show the point at which President Obama's Recovery Act began spending money.